Data visualization plays a vital part in data analysis. With so much information being collected through data analysis, data visualization gives business owners a clear idea of what each data point means in a visual format. This makes data collection an easy to comprehend process.
Why is Data Visualization Important?
The human mind has issues comprehending large strings of numbers or absurdly large numbers in general. This phenomenon is why our brain thinks the distance between 1 million to a billion and 1 billion to a trillion is the same because we’re adding three zeros each time.
Data Visualization vs. Non-Visualization
Our brains aren’t able to mentally understand scale, but visuals can offer some clarity. Digital visualization takes raw data, models it, and delivers it in a way that’s easy to interpret.
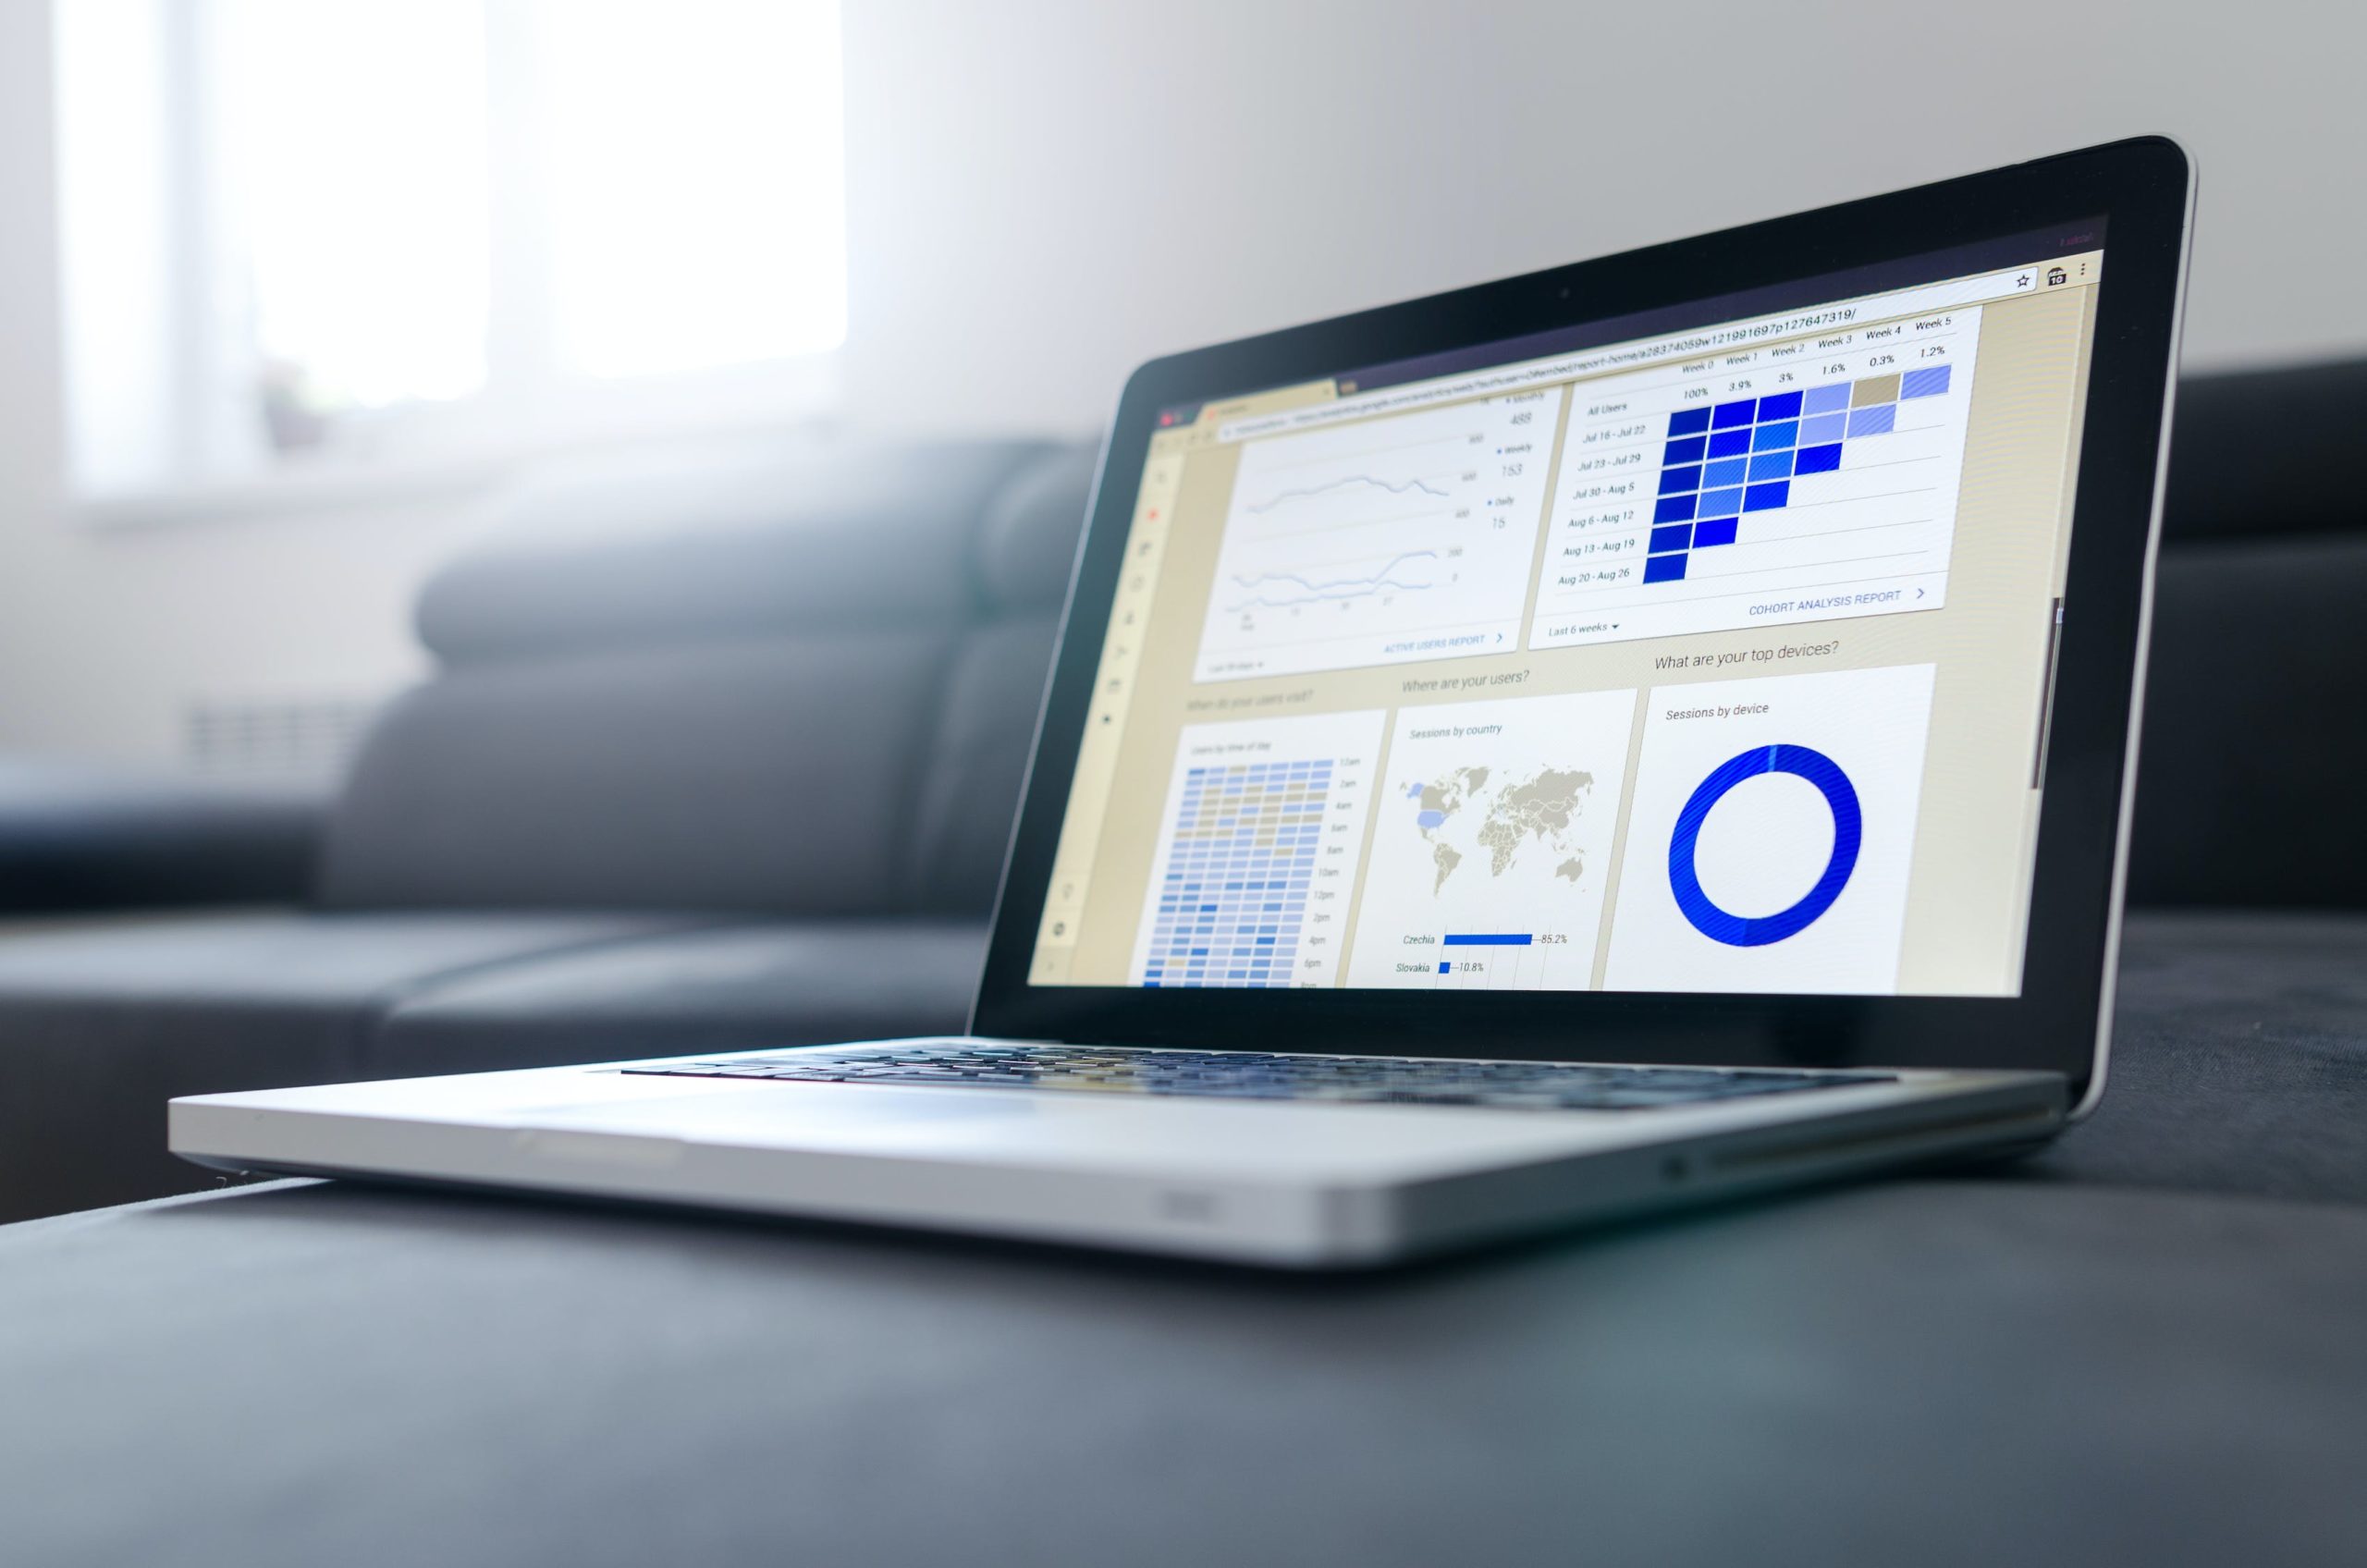
For example, if I was searching for heatmap alternatives for what I’m already using and I came across a program that visualized its data, I could quickly see drop-off points in my funnel.
With a non-visualized platform, I would have to spend time comparing raw data and various numbers. Not only will the data’s impact be less dramatic than with digital visualization, but I might not know how significant the drop-off is without a visual representation of the data.
Who Uses Data Visualization?
Data visualization uses visual data to communicate information in a fast, effective, and universal way. This practice can help companies identify areas that need improvement. By improving your website, you’ll positively affect your customer satisfaction and conversion rates.
All businesses and industries should use data visualization to target new markets and increase sales. Since the majority of advertising dollars are spent on online advertising, companies everywhere should use data visualization to gain critical insights about their business.
What are the Benefits of Data Visualization?
Visualized data gives business owners, stakeholders, and decision-makers a better understanding of their market. Here are more ways data visualization can benefit your website:
Structures Trends
Business owners can make valuable predictions about their industry when they gather past and present website data. Your trends can tell you where your business is and where it could possibly go in the future.
Find Correlations
Visualization helps you find data that shares a mutual relationship, also called a data correlation. When data correlates, it means they affect each other. You can use these data sets to locate why a feature is succeeding or failing.
Rate of Purchase
The rate of purchase, also called “frequency,” calculates how often a customer purchases your product or services. Visualization can give you a better idea of how new customers might act when you switch your acquisition or marketing strategy.
Risk and Reward
Without visualization, businesses must calculate their value and risk metrics using complex numbers and spreadsheets. Data visualization makes it easy to pinpoint where your team should or shouldn’t take action.
Market Examination
Businesses need to research their competition to examine their strengths, weaknesses, and potential opportunities. A visualized data set can put all of these points on one page, so you have a clearer picture of where to place your focus.
Quick Reaction
The process of manually creating visually appealing data sets can make it difficult for you to react quickly in a changing market. Software that populates your numerical data into graphs and charts saves you time and allows you to act swiftly.
There are different methods of putting together your data, from infographics to heatmaps to charts. Some programs will allow you to choose from several methods, so you can view your data from different angles. The best software will automatically visualize your data.
We need graphs and charts to communicate data findings and identify patterns easily to make decisions faster. Data visualization can keep you competitive in a growing market.
About the Author

Peter Makeshoff
Peter Makeshoff is the founder and main author of Designer Daily.